NVIDIA GPU Profiling & Monitoring Stack
Two independent hardware data sources
There are two things a GPU can be asked about.
The first is the performance monitoring units: counters distributed across the SMs, L2, and memory controllers, counting instructions issued, tensor-core pipe cycles active, DRAM read/write sectors, and similar. These are a limited, largely exclusive hardware resource.
The second is sensor and firmware state: power draw, temperatures, clock domains, ECC accumulators in the InfoROM, XID errors, NVLink and PCIe link health, row-remapping status. Cheap to read, always available, no contention.
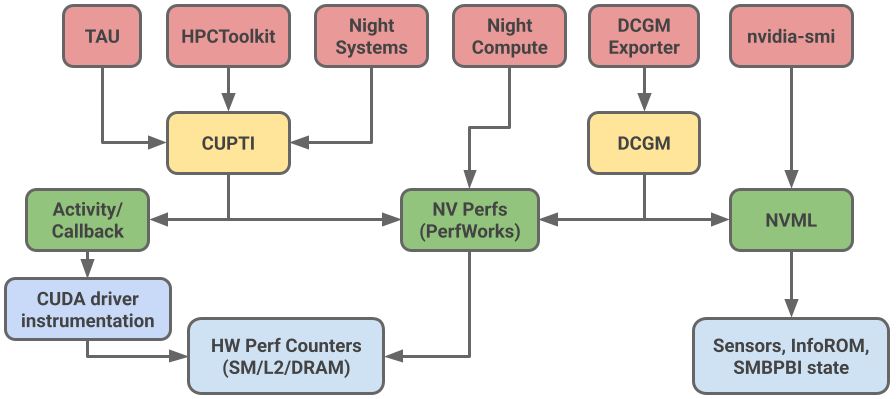
Access to the first goes through NvPerf (PerfWorks); access to the second goes through NVML. Every tool discussed below is a client of one or both.
PerfWorks, NvPerf, and Nsight Perf SDK
PerfWorks (rebranded as NvPerf and Night Perf SDK) is NVIDIA’s engine for programming and reading the performance counters on Volta and later. It handles counter multiplexing, kernel replay for multi-pass metrics, and the range-based push/pop model. It’s the single chokepoint for counter access, which is why it’s also the single point of contention.
NVML
NVML is the management library for the sensor/state path. It’s cheap, always available, requires no special permissions for most fields, and doesn’t touch the performance counters at all. On Hopper and later it also exposes GPM, which lets NVML sample a set of utilization-style metrics that used to require PerfWorks.
CUPTI
CUPTI is the in-process client library. Its Activity and Callback APIs don’t use hardware counters at all, they’re driver-level instrumentation that gives you the timeline of kernel launches, memcpys, and API calls with correlation IDs. Its Profiling API is a thin, CUDA-flavored wrapper over PerfWorks for when you want actual counter values. PC sampling is a third mechanism again, sampling the warp program counter and stall reason. The defining property of CUPTI is that it lives inside the target process and knows which kernel, which stream, which CPU thread.
DCGM
DCGM is the daemon-level aggregation of both paths. It reads NVML for the health, power, thermal, ECC, and XID fields, and it embeds a profiling module that talks to PerfWorks for the DCP metrics (SM active, SM occupancy, tensor active, DRAM active, pipe utilizations, NVLink/PCIe throughput). It adds things NVML doesn’t have: MIG-instance and per-process attribution, job-level accounting hooks for Slurm/Kubernetes, health watches, and the active diagnostic suite. dcgm-exporter is the Prometheus shim on top. DCGM is out-of-band and time-averaged — it tells you a GPU spent 40% of the last ten seconds with tensor cores active, but it cannot tell you which kernel did it.
nvidia-smi
nvidia-smi is just a CLI over NVML. It is device-scoped, application-agnostic, and never touches PerfWorks. This is why utilization.gpu is so widely misinterpreted: it’s a coarse time-sampled fraction of intervals during which at least one kernel was resident, not a measure of how much of the GPU’s throughput you’re using. A single-thread kernel occupying one SM shows 100%.
TAU
TAU (University of Oregon) instruments the CPU side through compiler instrumentation, LD_PRELOAD wrappers, MPI’s PMPI interface, and OMPT, then attaches CUPTI’s Callback and Activity APIs to fold GPU kernels and transfers into the same profile or trace. It can pull counter values either through CUPTI directly or through PAPI’s CUDA component, which is itself a CUPTI wrapper. Output goes to ParaProf, or OTF2 traces for Vampir.
HPCToolkit
HPCToolkit (Rice) is sampling-based rather than instrumentation-based on the CPU side — hpcrun takes timer or PAPI interrupts and unwinds the call stack. For GPUs it uses CUPTI’s Activity API for the operation timeline and, distinctively, CUPTI PC sampling plus SASS-to-source correlation from hpcstruct to attribute stalls to individual lines inside a kernel, reconstructing an approximate GPU calling context tree. Results land in hpcviewer.
Nsight Systems
Nsight Systems is mostly not a PerfWorks tool. Its core is timeline tracing, which it gets from CUPTI Activity/Callback (injected via CUDA_INJECTION64_PATH) plus a wide set of non-CUDA sources: CPU sampling with call-stack unwinding, OS runtime and syscall tracing (ftrace/perf on Linux, ETW on Windows), thread scheduling and blocked-state backtraces, NVTX ranges, MPI via PMPI, OpenMP via OMPT, NCCL, cuBLAS and cuDNN traces, graphics APIs, and NVML polling for coarse device telemetry. None of that needs the PMU, which is why plain nsys profile works for unprivileged users and coexists happily with dcgm-exporter.
Nsight Compute
Nsight Compute is PerfWorks-centric. Counters come from nvperf, and the metric names in its UI are literally nvperf metric names. But it also needs: its own API interception layer to intercept and control launches (its injection libraries, rather than CUPTI — the two tools are architecturally distinct here); a driver-supported state save-and-restore mechanism to make kernel replay work, the same capability CUPTI exposes as the Checkpoint API; cubin retrieval and SASS disassembly with line-table mapping for its source view; a warp-state/PC-sampling path for stall attribution, which is separate hardware from the aggregate counters; and NVML for device attributes, clock locking, and persistence mode.